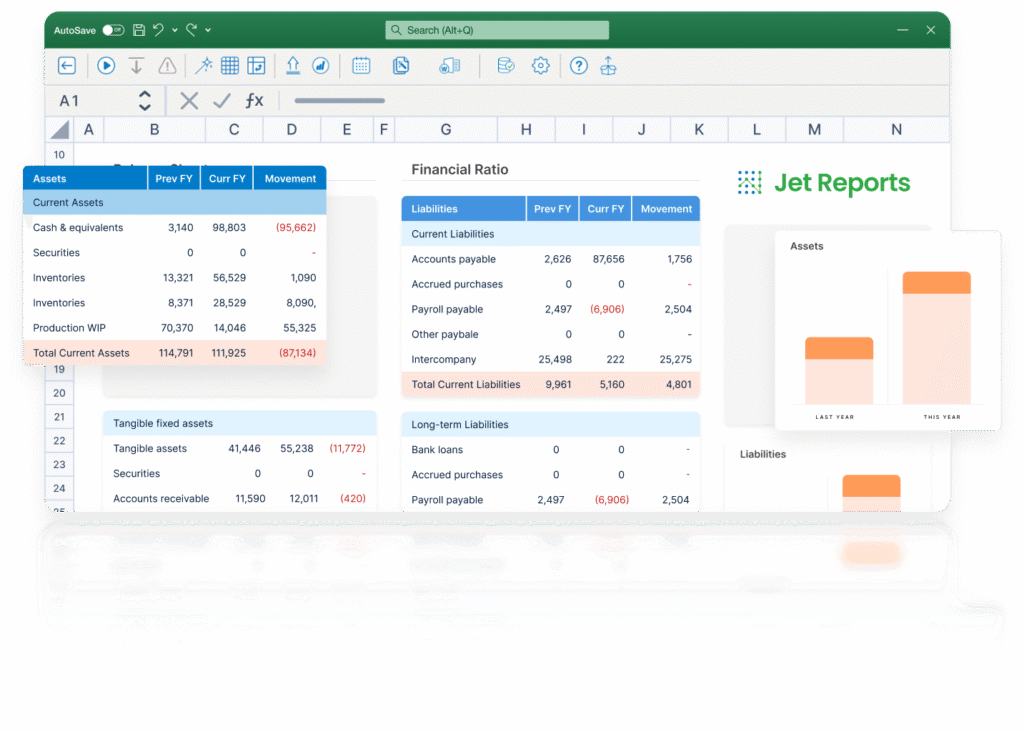
Create financial and operational reports directly in Excel, connected live to Microsoft Dynamics data, no coding required.

Integrate data from multiple systems into a centralized warehouse for fast, consistent reporting across entities.

Use ready-made data cubes and dashboards for finance, sales, inventory, and operations—customizable and scalable.

Feed clean, structured data to Power BI for interactive dashboards and company-wide performance tracking.


Organizations adopting Jet Reports and Jet Analytics benefit from faster reporting cycles, more accurate data, and reduced reliance on technical teams. These solutions are purpose-built for Microsoft Dynamics and are designed to support both everyday reporting needs and enterprise-level data management, without introducing unnecessary complexity or cost.

Automate recurring reports and reduce time spent gathering and formatting data.


Leverage the familiarity of Excel and the power of Power BI in tools designed for end users.
Yes. Jet Reports is used for operational reporting in Excel. Jet Analytics supports multi-source consolidation and advanced dashboards. However, both solutions complement each other and are often used together for a full reporting system.
Jet Reports is designed for finance and business users. Jet Analytics setup may require initial configuration but is maintained with user-friendly interfaces and templates.
Both tools are fully integrated with Microsoft Dynamics 365 Business Central, Finance, NAV, and AX, with no custom connectors required.
Yes. Users can build and customize their own Excel reports or Power BI dashboards to reflect KPIs and structures specific to their business.
Explore our full portfolio of comprehensive solutions and services, from custom software development to business consulting and automation. Whatever your business needs, we deliver tailored solutions that streamline processes and enhance efficiency.
We use cookies to improve your experience. With your consent, we can process data like browsing behavior or unique IDs. Without consent, some features may not work properly.